Catching data with fisheries or: how to science together
WIAS Magazine - Fall edition 2022
Research Overview
Keywords: bycatch, electronic monitoring, local ecological knowledge, North Sea, spatiotemporal modelling, turbot
On 3 and 4 November the Noordzeedagen took place here at Wageningen Campus. The main focus of the meeting was on the dilemmas we face regarding the North Sea biodiversity. Fisheries, along with wind parks, offshore oil and gas extraction, and others, are vying for space in the North Sea. The fisheries, already hit by high fuel prices, are in dire straits and are looking for alternatives to secure their existence. One alternative is to collaborate with research institutes and collect data for science. We attended the meeting with a poster on the usefulness of opportunistic data collection on the marine environment by fishers.
Background
Ecological studies on marine fish are often hampered by a lack of observational data (1-3). Research vessels are expensive and often available for only a limited amount of time. Meanwhile, fishing vessels catch a multitude of fish, often year-round. The catch rates of these individual ships are proxies for local fish abundances and can be related to environmental conditions. This will help to understand fish ecology, but may also aid policy makers with important management decisions concerning fish stocks and nature conservation. So, how about we get the fisheries on board and catch data for science?
Catching turbot
We focused on turbot, since it’s not a primary target species for the Dutch bottom trawling fleet. As a bycatch species, there is limited bias in selecting fishing areas with high catch rates, making turbot ideal for studying spatiotemporal distributions. Combined with environmental data from public sources, we can assess how, for example, weather conditions affect catch rates. To develop the model we used catch data from pseudonymised logbooks that were collected as part of the pulse fishing research in 2017-2019 by VisNed, an organisation representing Dutch fisheries. We used the R-INLA package, which stands for integrated nested Laplace approximation to do some complex Bayesian inferences (4, 5). Part of the preparation is to build a spatial mesh and stack the data (Figure 1) and then let INLA do its magic (Figure 2). Looks cool, no? We still want to work on this a bit more and include some priors from the fishers.

Figure 1. Simplified visual representation of data stacking, a key concept in advanced (geospatial) modelling with R-INLA. A mesh was used with coastlines as hard boundaries. The catch data shown here are classed per 5 kg turbot, where darker colours represent bigger catches. Bathymetry is the water depth in metres, where the darker the blue, the deeper the sea.

Figure 2. Effect sizes of the (environmental) variables included in our model. Any variable outside 0 is considered an important effect (either positive or negative).
Perspectives
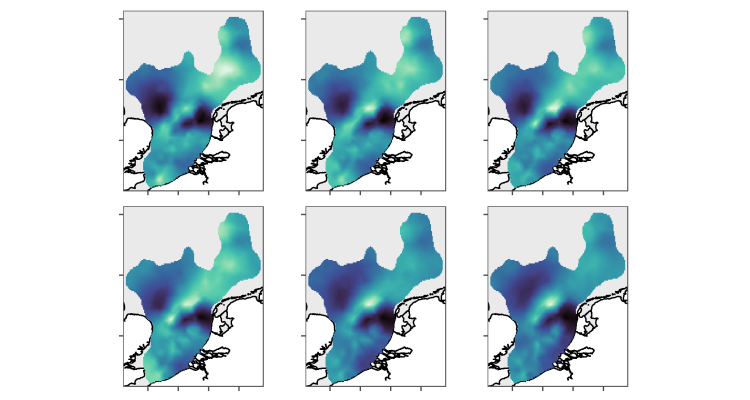
We also built a Shiny app that visualises the spatial distribution of expected catch rates per vessel at a given moment in time. Very nice to play around with; just imagine what is possible when we can feed it with live data... However, let’s not get carried away, there are some challenges to be overcome. What about conflicting interests: commercial species are interesting for data collection, but preferably this data is not shared with others. On the other hand, for non-commercial species there is less motivation to collect data, but sharing this data is fine. In addition, the calibration of sensory equipment on board fishing vessels is not very straightforward. We would prefer a standardised setup that is scientifically sound with data stored onshore. This brings us to: who will be the central body responsible for data management? These are points for discussion with all the stakeholders.
Our poster attracted quite some attention, but mostly from peers. However, one of the Break-out sessions on the Friday was led by representatives of the fisheries and talked about alternatives, in particular the collection of data.
The Catching Data project was funded by the European Maritime and Fisheries Fund (EMFF).
References
1. Poos JJ, Aarts G, Vandemaele S, Willems W, Bolle LJ, van Helmond ATM. Estimating spatial and temporal variability of juvenile North Sea plaice from opportunistic data. Journal of Sea Research. 2013;75:118-28.
2. Steenbeek J, Buszowski J, Chagaris D, Christensen V, Coll M, Fulton EA, et al. Making spatial-temporal marine ecosystem modelling better-A perspective. Environmental Modelling & Software. 2021;145.
3. Townsend M, Davies K, Hanley N, Hewitt JE, Lundquist CJ, Lohrer AM. The Challenge of Implementing the Marine Ecosystem Service Concept. Frontiers in Marine Science. 2018;5.
4. Lindgren F, Rue H, Lindstrom J. An explicit link between Gaussian fields and Gaussian Markov random fields: the stochastic partial differential equation approach. Journal of the Royal Statistical Society Series B-Statistical Methodology. 2011;73:423-98.
5. Rue H, Martino S, Chopin N. Approximate Bayesian inference for latent Gaussian models by using integrated nested Laplace approximations. Journal of the Royal Statistical Society Series B-Statistical Methodology. 2009;71:319-92.


